
In almost any European city, one neighbourhood can have double the income of another fifteen minutes' walk away. And that difference doesn't show in the shop window: selling a set menu at €18 or at €9 isn't about the product, it's about the street. Knowing an area's income before you set prices is the difference between getting it right and burning money.
What average income is (and why it isn't the same as a salary)
The average income of a neighbourhood is the mean of the net annual income of the households in that area. It includes wages, pensions, rental income and benefits; it isn't the same as one person's average salary. It's what a household has available to spend, save and pay the bills.
For your business it means one thing: the spending ceiling of your average customer. To picture it, imagine two areas: in one with a high income, a special €80 dinner is decided without a second thought; in another with a more modest income, that same dinner becomes an anniversary event. It's neither good nor bad, they're simply different businesses.
Mean vs. median: the most common trap
The mean adds up all the income and divides it among the households. The median is the central value: half of the households earn more, the other half earn less.
The difference matters when an area has a lot of inequality. In a neighbourhood with four very wealthy families and a hundred modest households, the mean comes out high and misleading; the median better reflects what the majority is like. If you can choose, always look at the median for pricing and positioning decisions. For total-potential decisions (aggregate income), the mean does the job.
Where the official data comes from
Every country publishes household income through its official statistics institute, and across Europe almost all of them do it on comparable terms. What matters is the level of detail: the best sources go down to small areas (on the order of 1,500-2,500 inhabitants), much finer than a postcode. In Spain, for example, the INE's Household Income Distribution Atlas reaches census-tract level; you'll find it at www.ine.es.
Two things worth bearing in mind in any country. First: the official figure is usually published with a lag of one or two years compared with the period it measures. Second: to compare across countries, Eurostat offers harmonised versions, and many large cities keep open-data portals with figures that are sometimes more recent and more granular than the national ones.
An illustrative example (made-up numbers to explain it)
Let's take a fictional case to see how the mechanism works. Imagine a European city whose mean was €18,000 of net income per household. Within that same city very different profiles could perfectly well sit side by side. The figures below are made up and rounded, purely to illustrate; the real data for your city always comes from the official source in each country:
- Well-established central area: say €26,000, well above the mean. It usually has a highly educated population and low unemployment.
- Neighbourhood in transition: around the city's mean, with a young profile that changes fast from one year to the next.
- Residential outskirts: around €16,000, with larger households and a different spending structure.
- Dense, working-class area: let's say €13,000, below the mean. Different density, different profile, different business.
Two things this example teaches. First: neighbouring areas can have incomes that differ by double. Second: there's no universally "good" income; what's good is for it to match your offer.
How to use income to decide
- Setting prices. If your average spend sits at 0.4-0.7% of the monthly household income of the area, you fit. Above 1%, you're fighting against your customer's wallet.
- Deciding your range. High income doesn't automatically mean "premium"; it means more sensitivity to quality and service. Lower-to-middle income isn't "cheap"; it's "better value for money".
- Filtering areas in a premises search. If your business needs a minimum income of €22,000 to work, rule out the ones that fall short from the very start.
- Calibrating your advertising. High-income district = editorial channels, recommendation. Lower-to-middle-income district = offers, promotion and word of mouth.
3 mistakes when reading income
- Sticking to the mean alone. If the median is very different, the area is unequal and your typical customer isn't who you thought.
- Using old data in areas that have changed. Many neighbourhoods in transition change profile in barely five years. Working with figures from half a decade ago can land you in a neighbourhood that no longer exists.
- Confusing high income with low competition. Wealthy areas tend to be saturated. A high income without a competitive gap guarantees you nothing.
How it looks in POINOVA
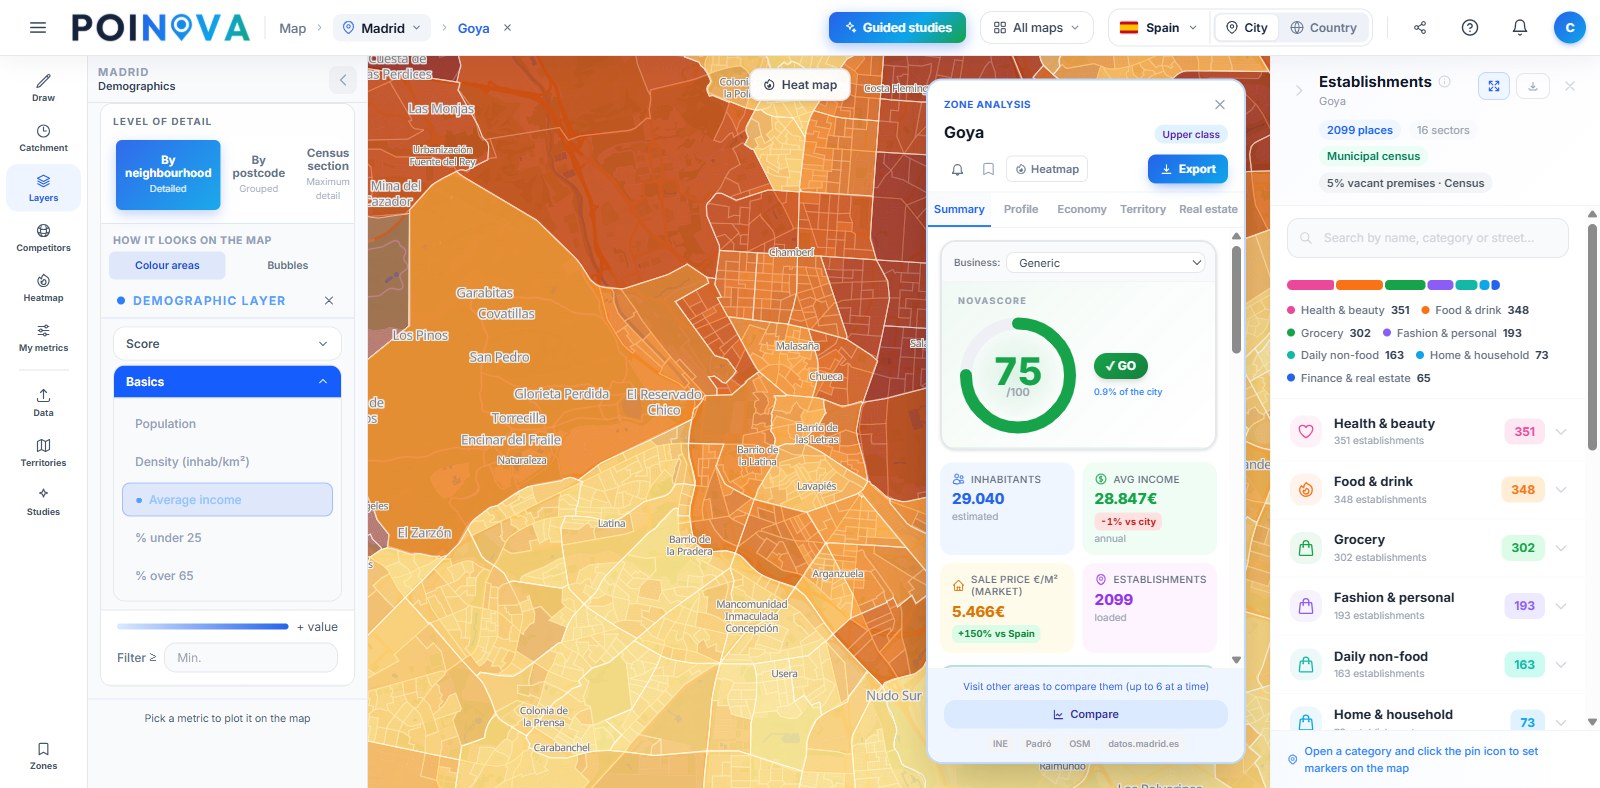
You draw an area on the map and POINOVA returns the income and population of that area for free (with Pro, you also get education, the age pyramid and more than 60 indicators), with the official source cited (the statistics institute that corresponds to each country). You don't have to download tables, cross-reference them or interpret area codes: the tool does it.
What you get with POINOVA
- Official income and demographics by area
- Competition and points of interest on the map
- Catchment area on foot, by bike or by car (isochrones)
- NovaScore 0–100 to compare areas
- PDF/Excel report with the sources cited
Try the analysis on a real area
See the income of the neighbourhood you're interested in before you make your next pricing or location decision.
Try for free