Put your stores on the map, see how far each one reaches and where they overlap, and choose your next opening based on the population, income and competition in each area, before you sign the lease.
Free, no card needed: residents and a few metrics for each area. Your stores on the map and where they overlap, competitors and NovaScore start on Pro.
How far each store reaches, who lives nearby, where competition is tight and where there is room for the next one.
Upload your stores as an Excel or CSV file and we draw around each one the area it reaches in the minutes you choose, on foot, by bike or by car. You see which parts of the city are left uncovered and how many people live within reach of your network. Then we shade in red where two stores reach the same people, and show you how many overlap and what share of your audience they compete for.
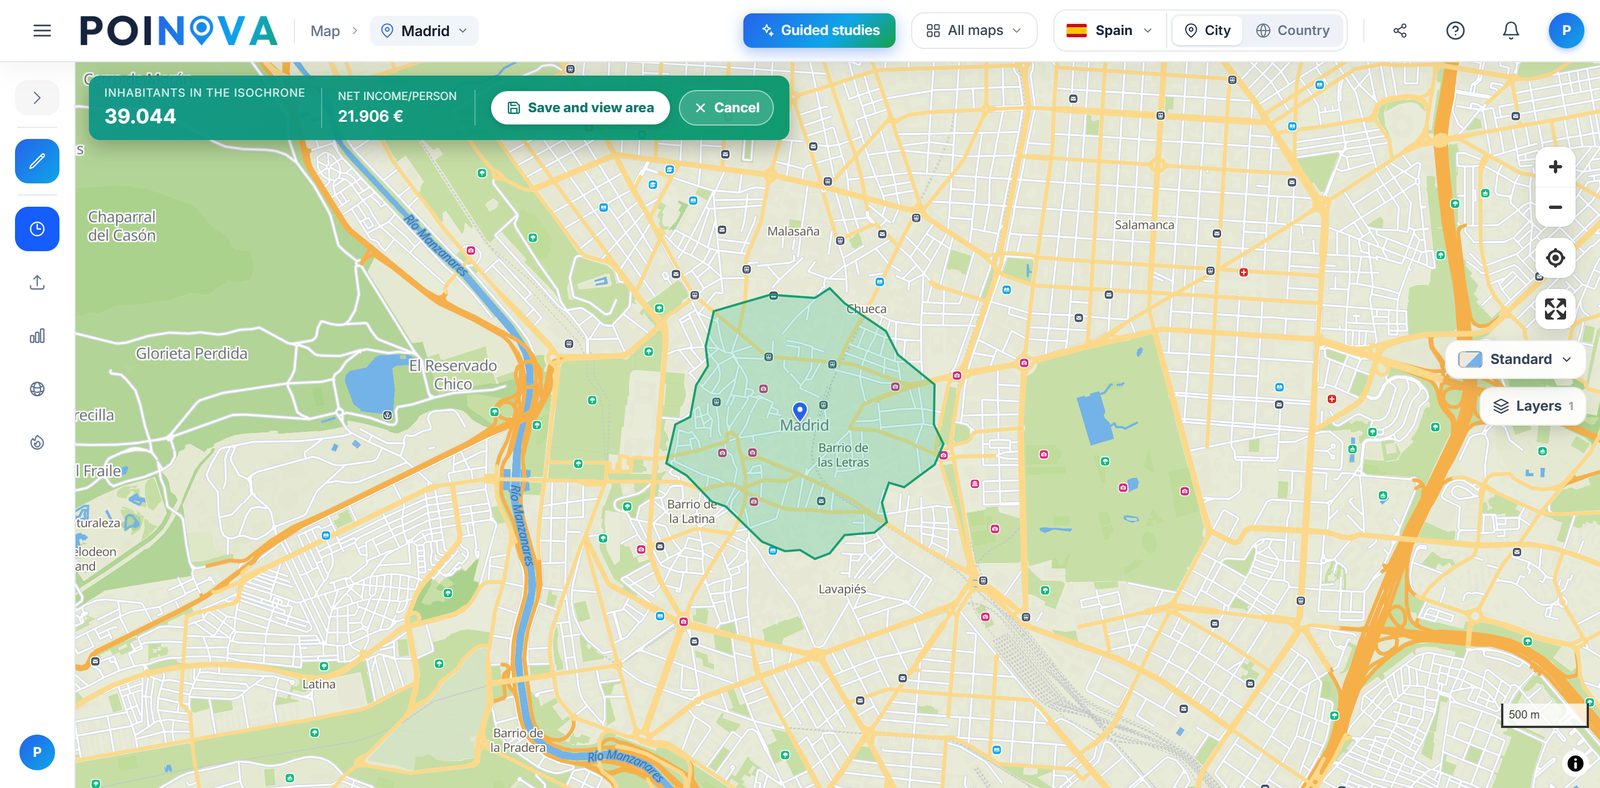
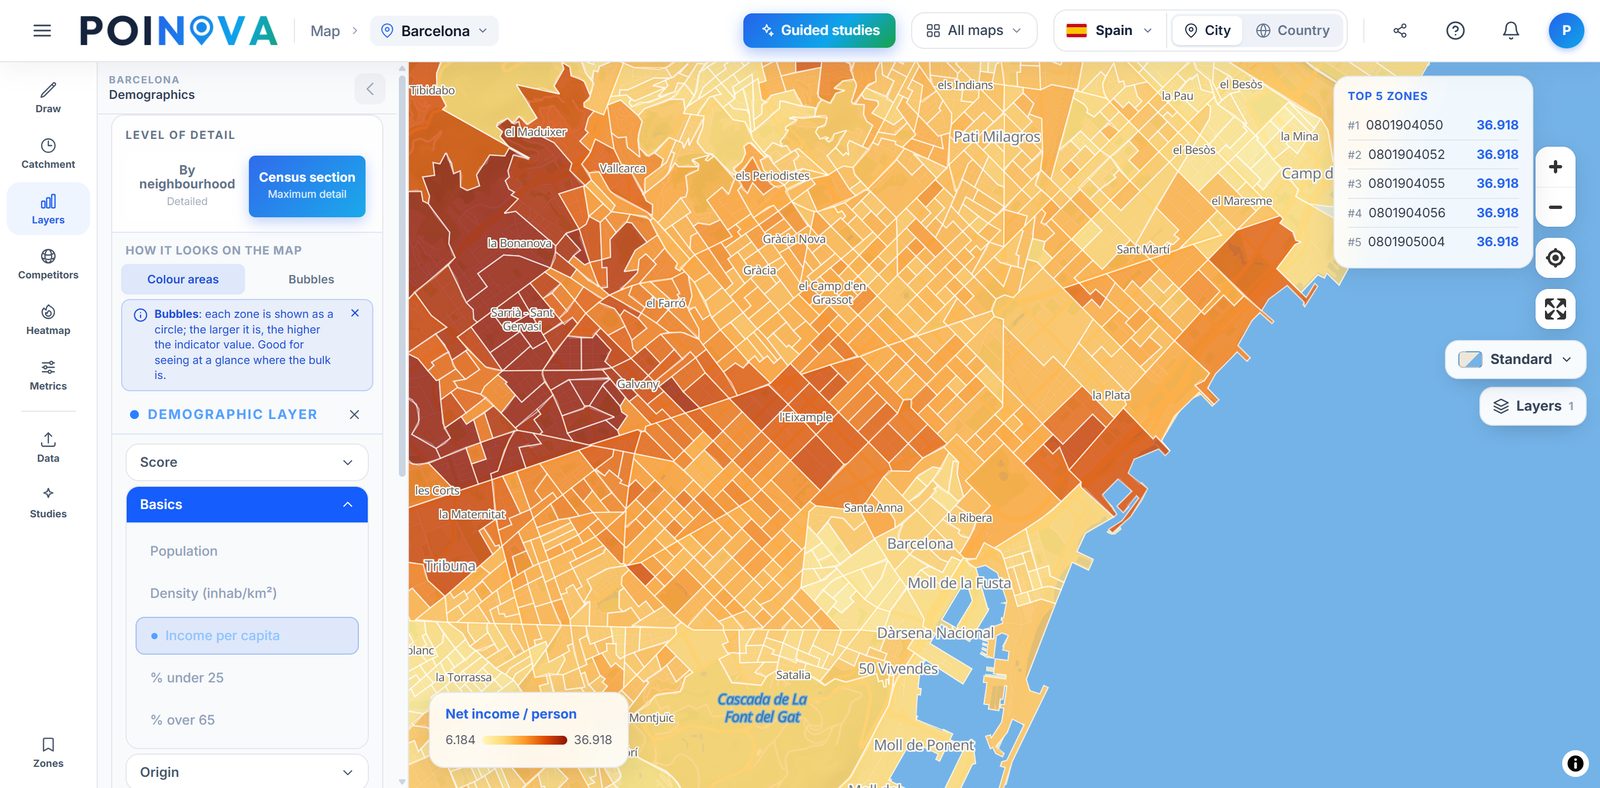
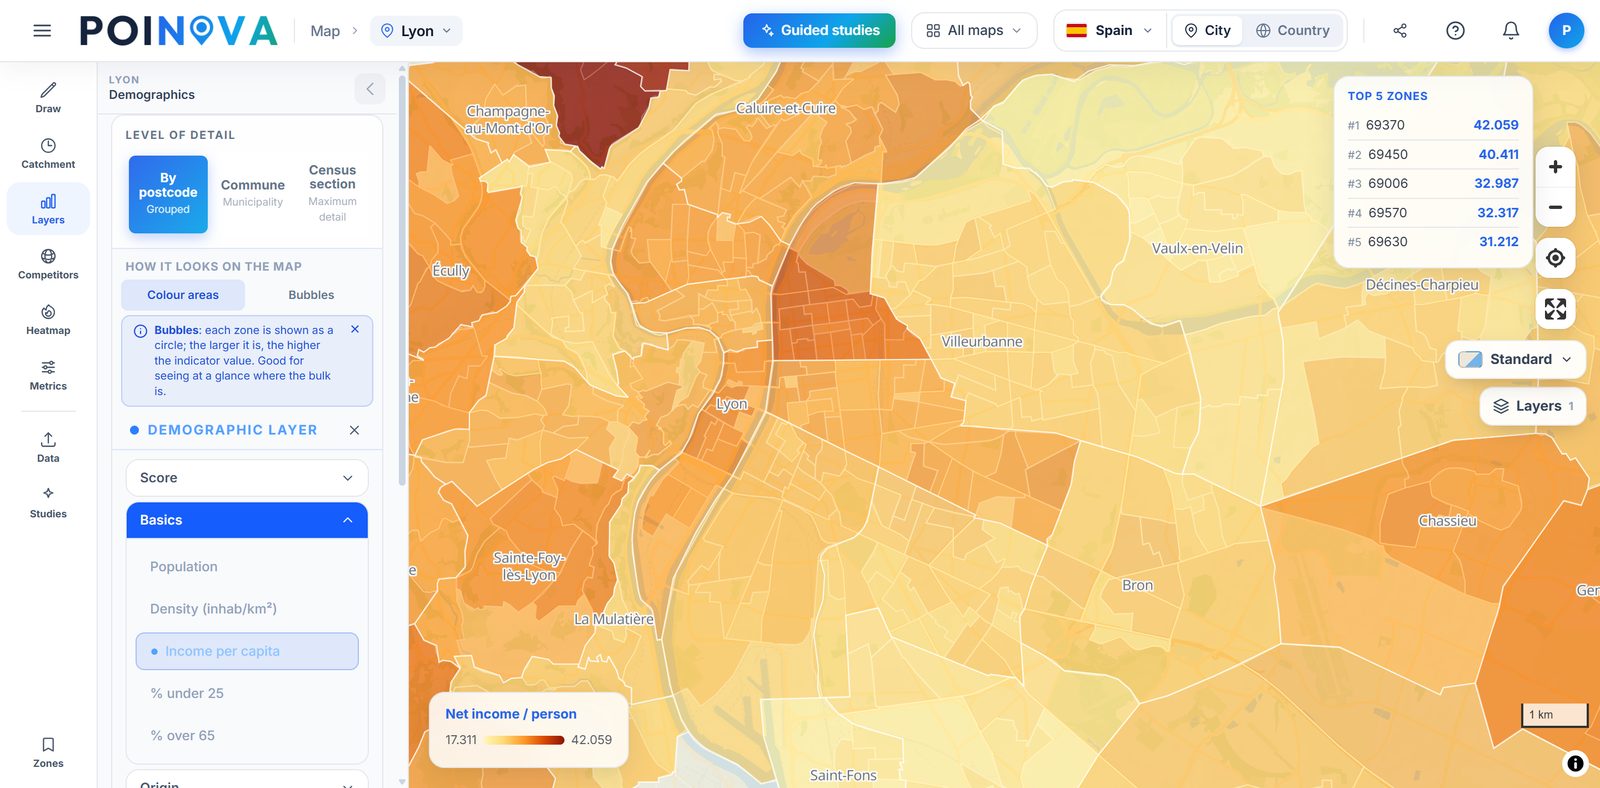
Shade the map by population, density, income and the share of young and older residents, at the finest level each country publishes, and draw the area within walking, cycling or driving time of any store to see how many people live there. On the Pro plan you also get 60+ indicators per area.
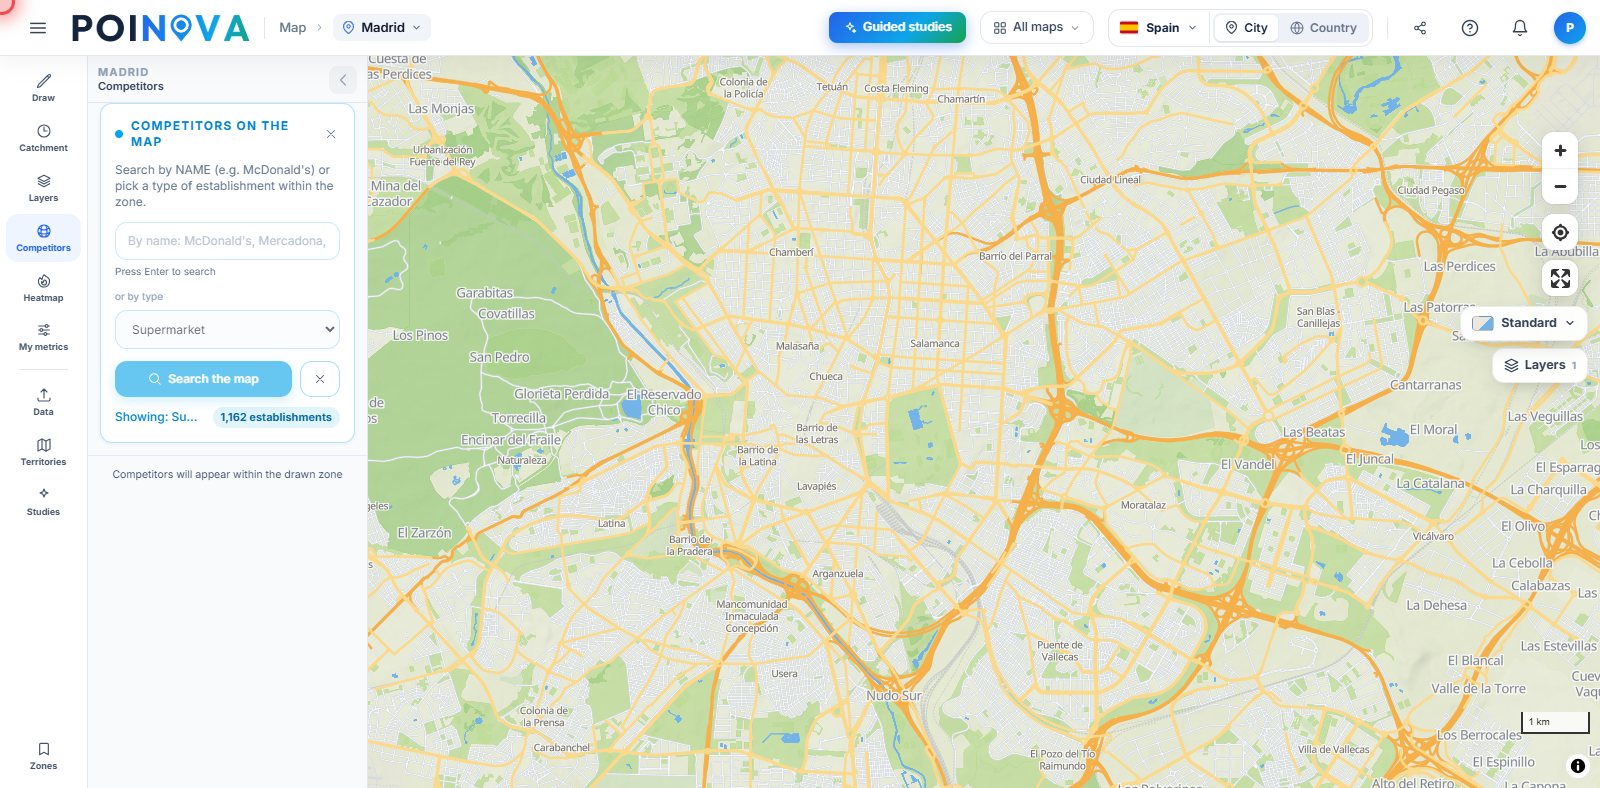
Search the map for businesses in your sector by type or by brand name, and see which areas are saturated and which are still unserved.
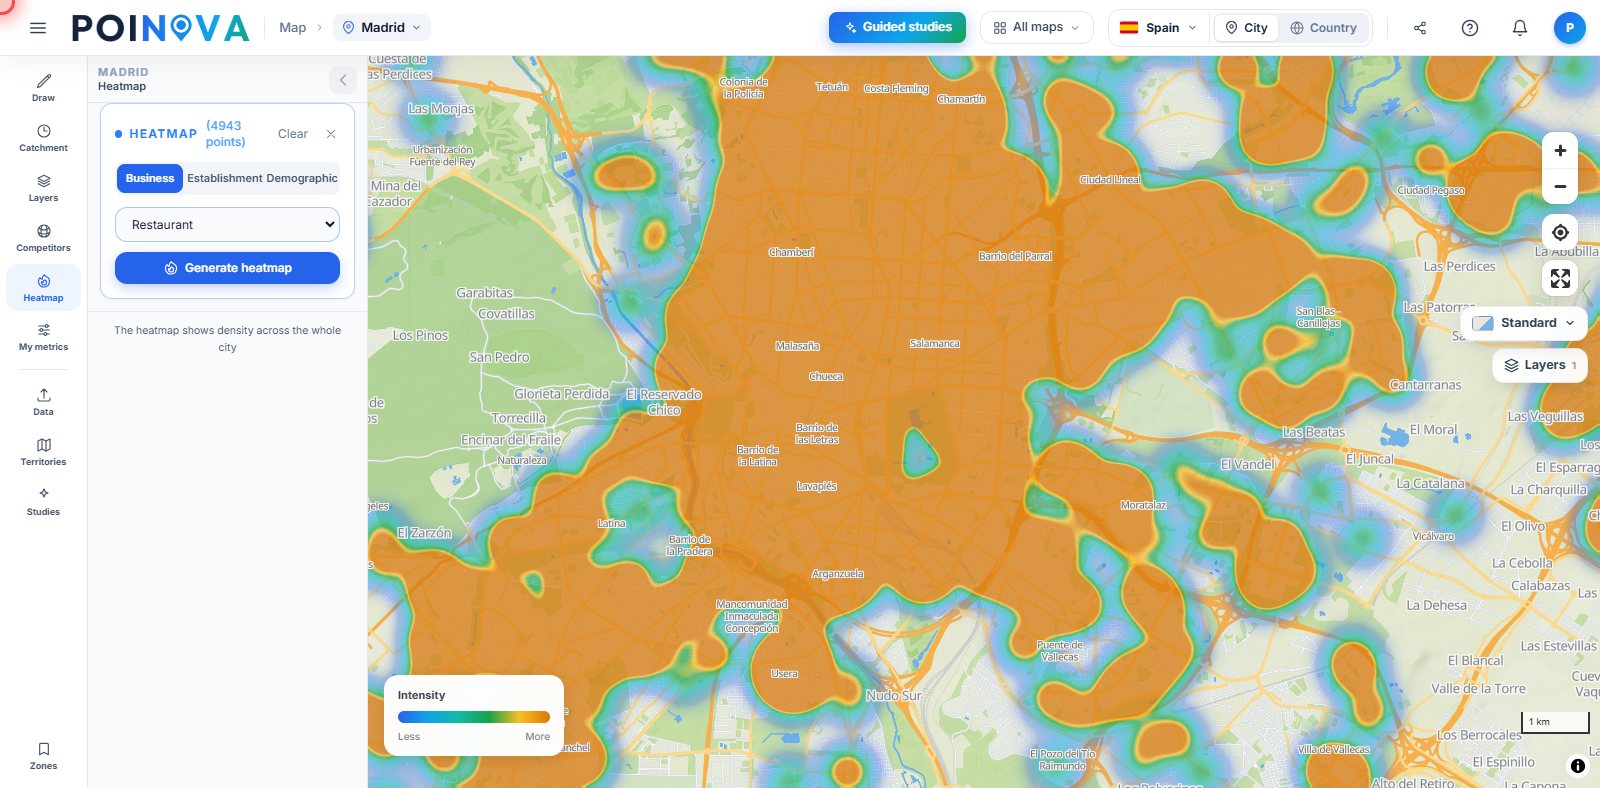
We turn your stores into a heat map that you can weight by a numeric column in your file, such as revenue, to see where your presence and your sales are concentrated. Underneath, we shade population density or income, so you can see where there is demand but no store of yours.
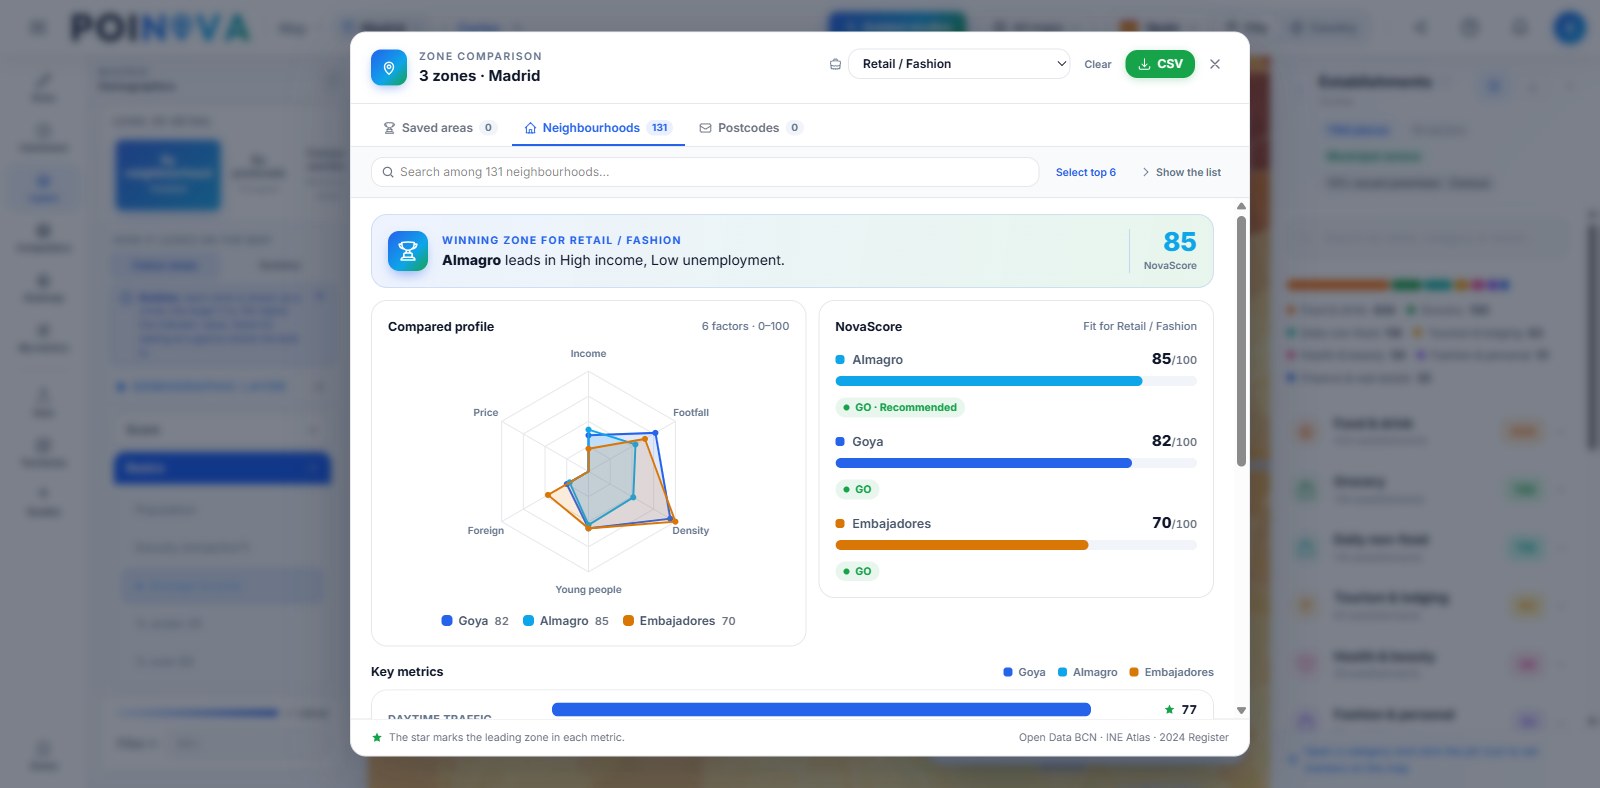
Put several areas side by side, choose your type of store and we rank them by NovaScore, a 0 to 100 score for the conditions each one offers, using the same criteria for all. On the Advanced plan you also get the “Second premises without cannibalisation” guided study, which takes the neighbourhood of one of your stores and suggests others with the same demand profile, far enough away not to take its customers.
In the “Where to launch the campaign” guided study, you choose who you want to reach, for example young people, older residents or high earners, and we rank the city's neighbourhoods by how concentrated that audience is, with their postcodes where available. Download it as an Excel file for your leaflet distributor or your agency.
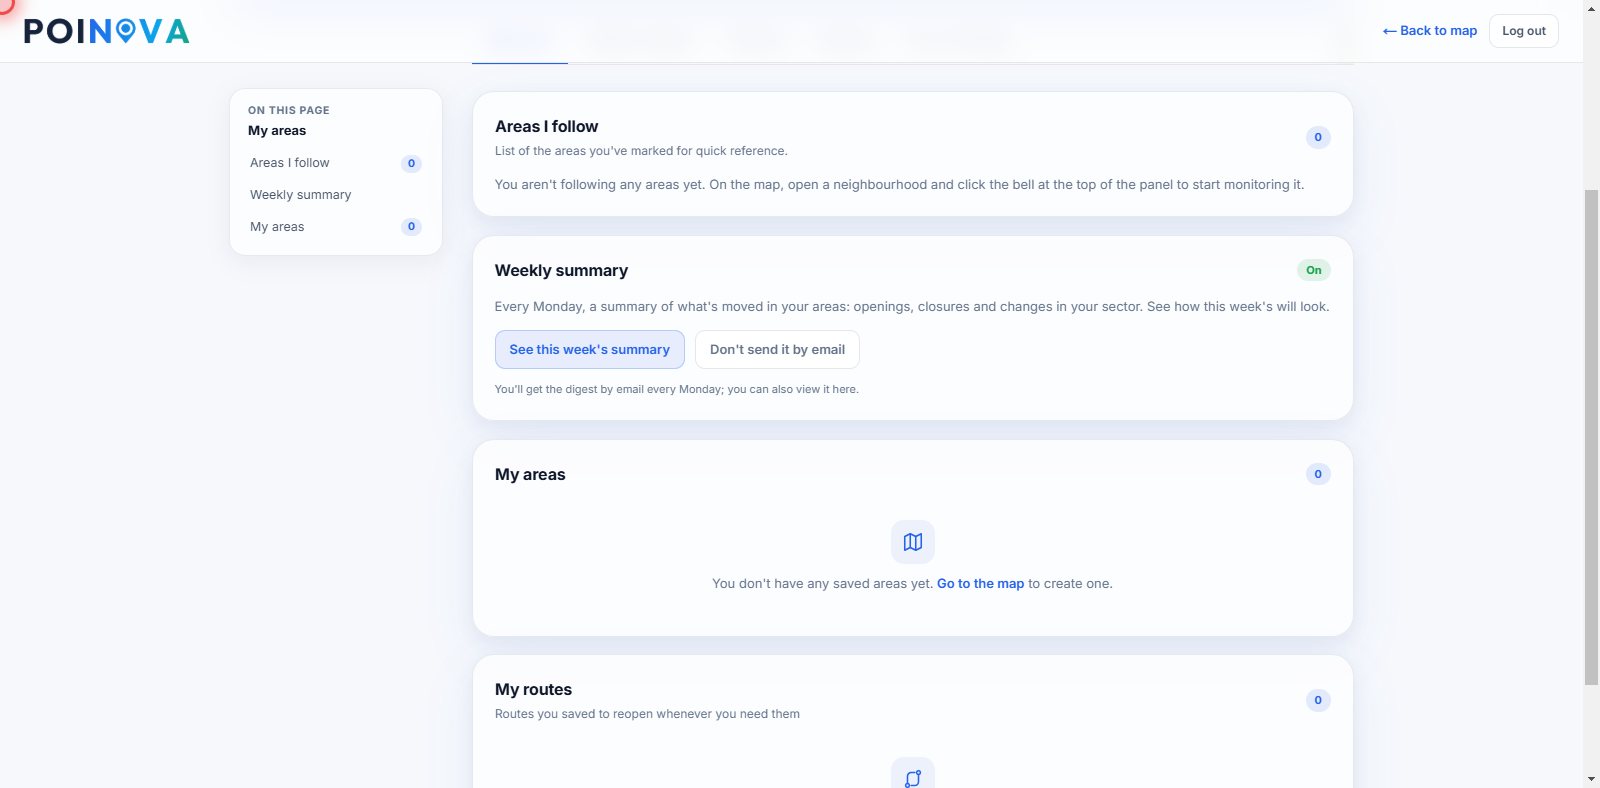
Follow the areas where you have stores and every Monday we send you a summary of the businesses that have opened and closed there. On the annual Advanced plan you can also set threshold alerts on an area metric, get an email when one is crossed and see how each area has changed over time in the trend history.
Start free and upgrade when you need to. Each plan includes everything in the previous one.
Your stores on the map, how far each one reaches and where they overlap, competitors by type or by brand, NovaScore and 60+ indicators, area comparison, the essential guided studies and PDF and Excel reports. On the annual plan, monitoring of your areas and a weekly summary of openings and closures.
A heat map of your stores, weighted by revenue or any other column in your file, neighbourhoods that look like the ones around your stores where you are not present yet, the “Second premises without cannibalisation” study and merging or subtracting areas. On the annual plan, threshold alerts and each area's trend history.
Several users from the same domain for expansion, operations and management, each with their own account and every feature, and area and guided-study PDF reports with your logo and colours, ready for your openings committee. Annual billing only.
| POINOVA | Corporate location platforms | Traditional consulting | |
|---|---|---|---|
| Detailed official data | Yes, and sourced (in full from Pro) | Depending on the plan | Depending on the project |
| Get started | On your own, no sales rep | Demo and sales | Meeting and proposal |
| Getting the result | In minutes | Days | Weeks |
| Price | Public, with a free plan | Depending on the provider | Depending on the project |
| GDPR · servers in the EU | Yes | Varies | Varies |
Indicative comparison by product category, not by specific brands.
Start free: see who lives around each store, no card needed. Competitors, NovaScore and area comparison start on Pro.
Try for free