Home · Industries · Real estate and consultancy
Real estate & consulting

Geomarketing for real estate and consultancy

Deliver location studies to your clients in minutes, not weeks. Official data, clear maps and a presentable report, without setting up an analysis department.

What it solves for you

More studies, in less time

Turn area analysis into a service that is quick to deliver and easy to defend to your client.

Studies that used to take weeks

Generate an area analysis in minutes and spend your time advising, not gathering data.

Reports that don't look the part Pro

Deliver a clear document with cited official data, easy to show your client.

Justifying recommendations Pro

Back them up with real population, income and competition, not impressions.

Use cases

How you decide which areas to focus your agency on

Cross-reference income, the profile of the people who live in each neighbourhood and, where available, housing prices to know where to source properties and back every recommendation with data.
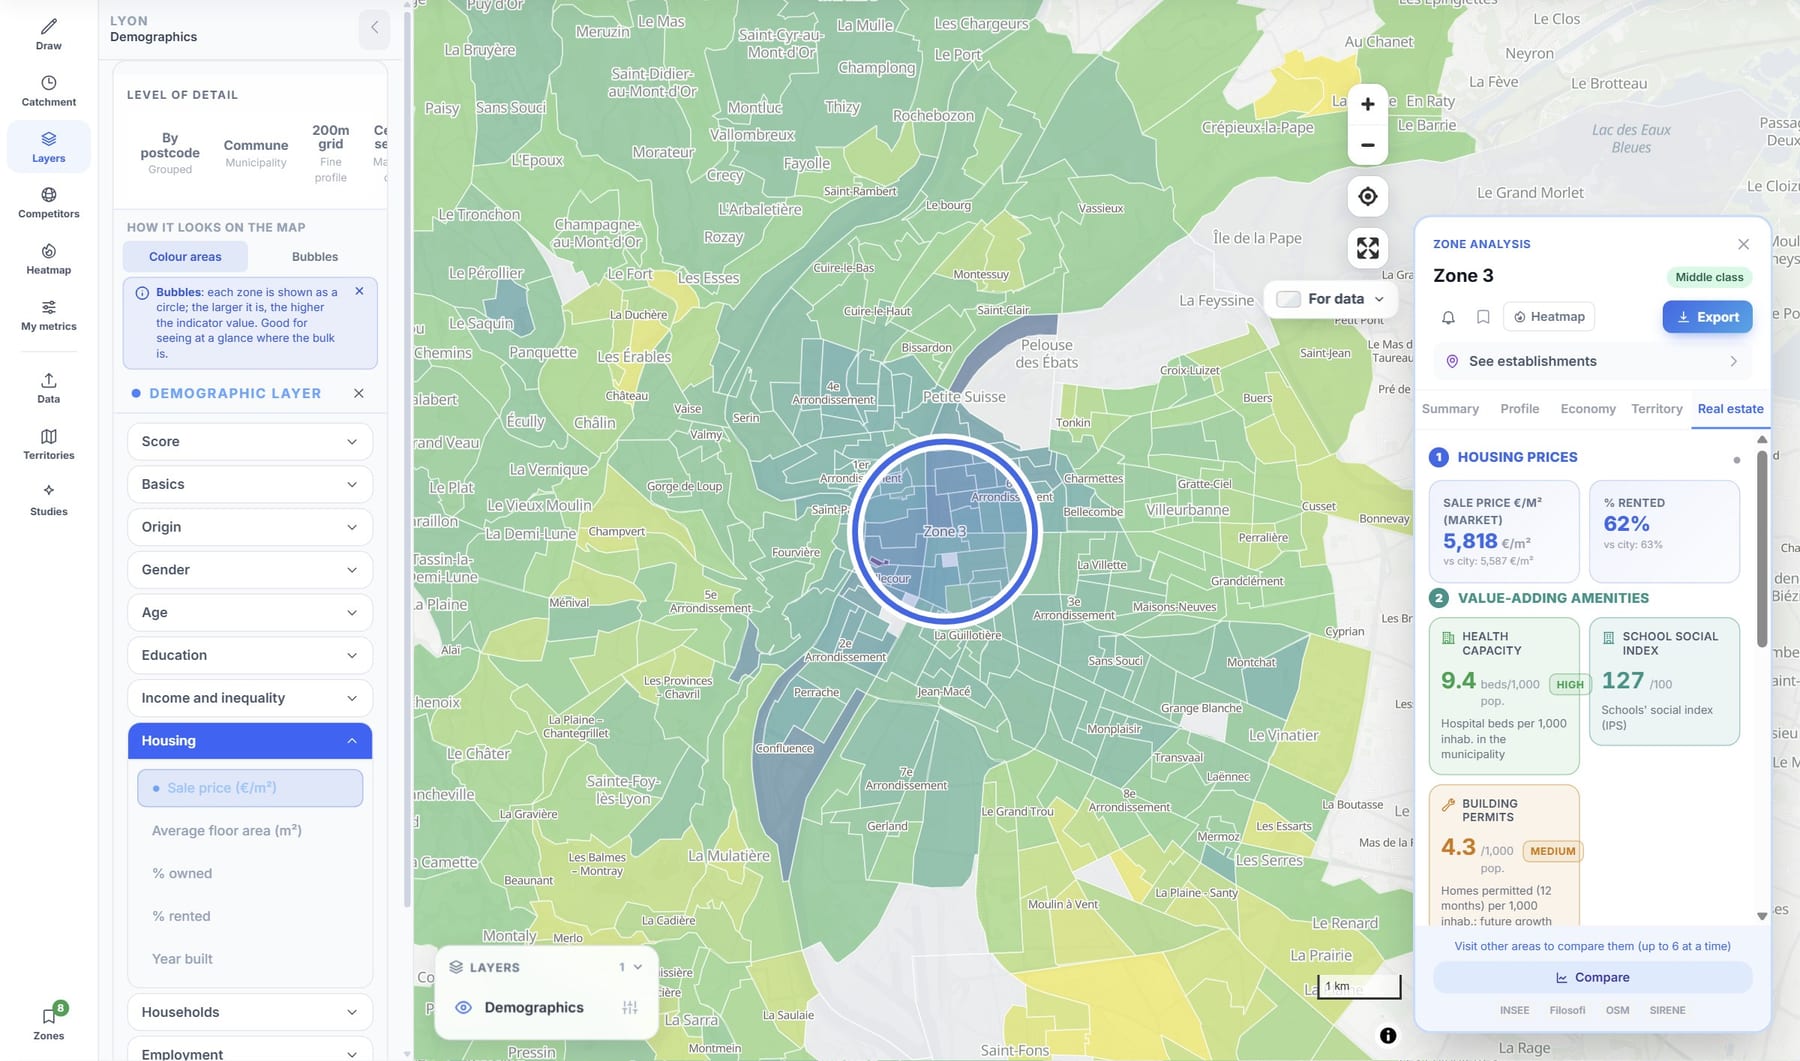
POINOVA map with the sale price per m² and the real estate sheet of an area

Rate areas by income and price Pro

Before sourcing properties in a neighbourhood, you check its income level and, where available, compare it with the area's housing prices. With POINOVA's income map you see which areas fit the type of property you work with and decide where it is worth focusing your effort.

Find your target buyer Pro

You look for neighbourhoods where your ideal buyer lives, whether families, young people or high-income profiles. You filter by population, age and income to pinpoint those areas and focus your sourcing and advertising where that audience lives.

Compare areas before investing Pro

You have several candidate areas for a development or an investment and you don't know which to prioritise. You place the neighbourhoods side by side with the same yardstick and deliver a clear report that justifies which one is worth entering.

Real estate and consulting

Location studies that win clients

Analyse the areas your clients ask about and hand them a clear, defensible report in minutes, not weeks.

Score every location Pro

If your client is opening a business that serves the public, the NovaScore rates from 0 to 100 the conditions each area offers for that type of business and helps you justify why one fits better than another.

Gauge the saturation Pro

See which businesses already operate nearby, by type, and warn your client when an area is saturated.

Compare candidates Pro

Put several properties side by side against the same yardstick and back your recommendation with solid arguments.

Deliver the report Pro

Export a clean PDF or Excel file, with sources cited, ready to present to your client.

Frequently asked questions

Frequently asked questions about POINOVA for estate agencies and consultancies

What neighbourhood data can I show my client?
On the free plan: population, density, income and the share of young people and over-65s in each area. On the Pro plan: more than 60 indicators on who lives there, plus the businesses already operating nearby.
Can I see housing prices for an area?
Yes, on the Pro plan, in the Real estate tab and where we have data: home purchase and rental prices and nearby amenities such as schools, public transport or health centres. We don't give prices for commercial premises.
Can I compare neighbourhoods or areas?
Yes, on the Pro plan or higher. You pick or draw each area, place them side by side with their data and show your client where it is worth sourcing properties or investing.
Can I hand my client a report?
Yes, on the Pro plan or higher you can download the area report as a PDF or Excel file. The data comes from official public sources and open sources, cited in the report, and when a figure is an estimate, we say so.
What does the free plan include, and what comes with Pro?
Free, no card required: a map with basic demographic data, population by area, country view by areas, drawing areas (2 isochrones a day) and up to 3 saved areas. On Pro: NovaScore and 60+ indicators, competitors and points of interest, PDF and Excel reports, guided studies and territories.

Turn analysis into a service

Try it free with one area and see its basic demographic data on the map. No card required.

Try for free

Included in the free plan: Map with basic demographic data · Population by area · Country view by areas · Draw areas (2 isochrones a day) · Up to 3 saved areas.
Not included (unlocks when you upgrade): NovaScore and 60+ indicators · Competitors and points of interest · PDF and Excel reports · Guided studies · Territories.
See plans
Real estate & consultingTry for free